The wait is over (almost). Since the introduction of vSphere Web Client, many admins have slowed down the adoption of the Web Client as well as updates to vSphere due to the performance of said client.
VMware has released a couple of flings in relation to this problem. One of them was the host web client, where you can manage your hosts directly without the need to install the vSphere client. This fling is now part of the latest update to vSphere 6.0 U2. A few days ago, VMware released a similar option for vCenter. Both of these options are based on HTML 5 and javascript.
Host Web Client
Like I mentioned before, starting with vSphere 6.0 U2, the host web client is already embedded into vSphere. If you do not have this update you can still download the OVA and access the host web client that way. Currently it only works if you have vSphere 6.0+ but once version 5.5 U3 is released, it will also work with that version. Here is a link to download the fling.
To access the web client, you will need to add “/ui” at the end of the name/ip address of your host. For example https://<host-name-or-IP>/ui
The client is very responsive and has a nice UI. Not all the features are currently supported, but more will be coming at some point in the near future.

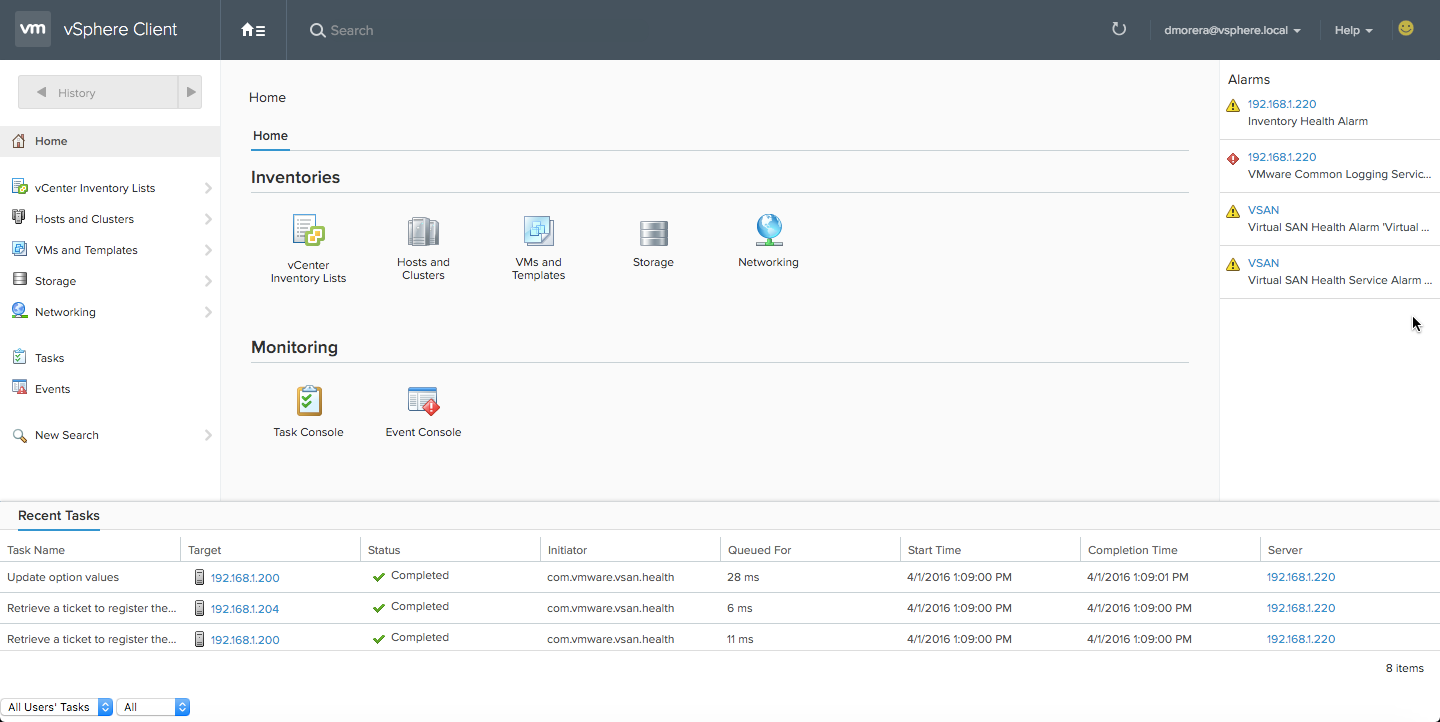
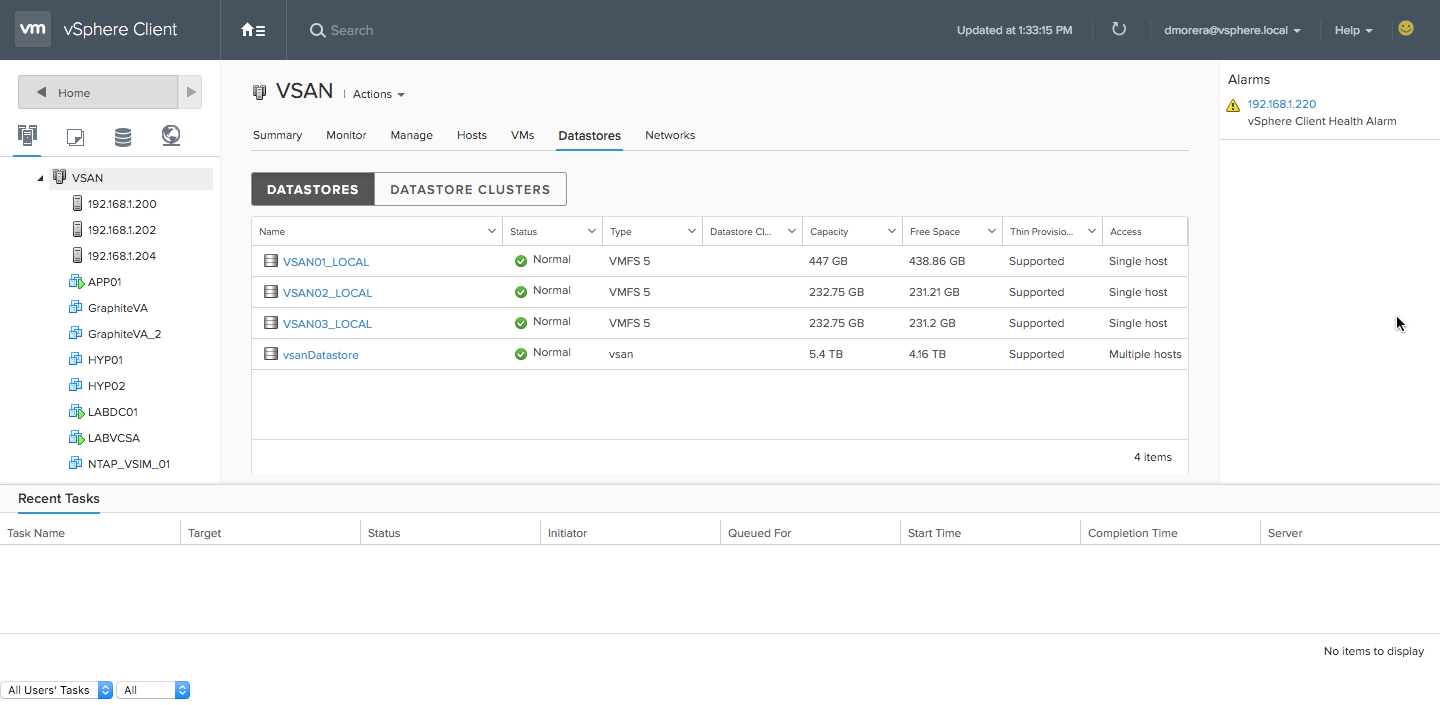
vCenter Web Client
This HTML web client is only available as a fling at the moment. You will need to deploy an OVA and register the appliance with the vCenter that you would like to manage. Being a fling, not all features are included. It basically focuses on VM management, but I am sure they are working to port all the features over at some point (I hope).
To deploy this ova, you will need to enable SSH and Bash Shell on your VCSA. You can do both from the VCSA web UI. If you are running Windows based vCenter refer to the Fling documentation here.

Prior to going through the configuration you will need to
- Create an IP Pool (If deploying via C# Client)
- Note: I deployed using Web Client and didn’t create the IP Pool for me automatically as it is supposed to, so double check you have an IP Pool before powering on the appliance
- Deploy the OVA

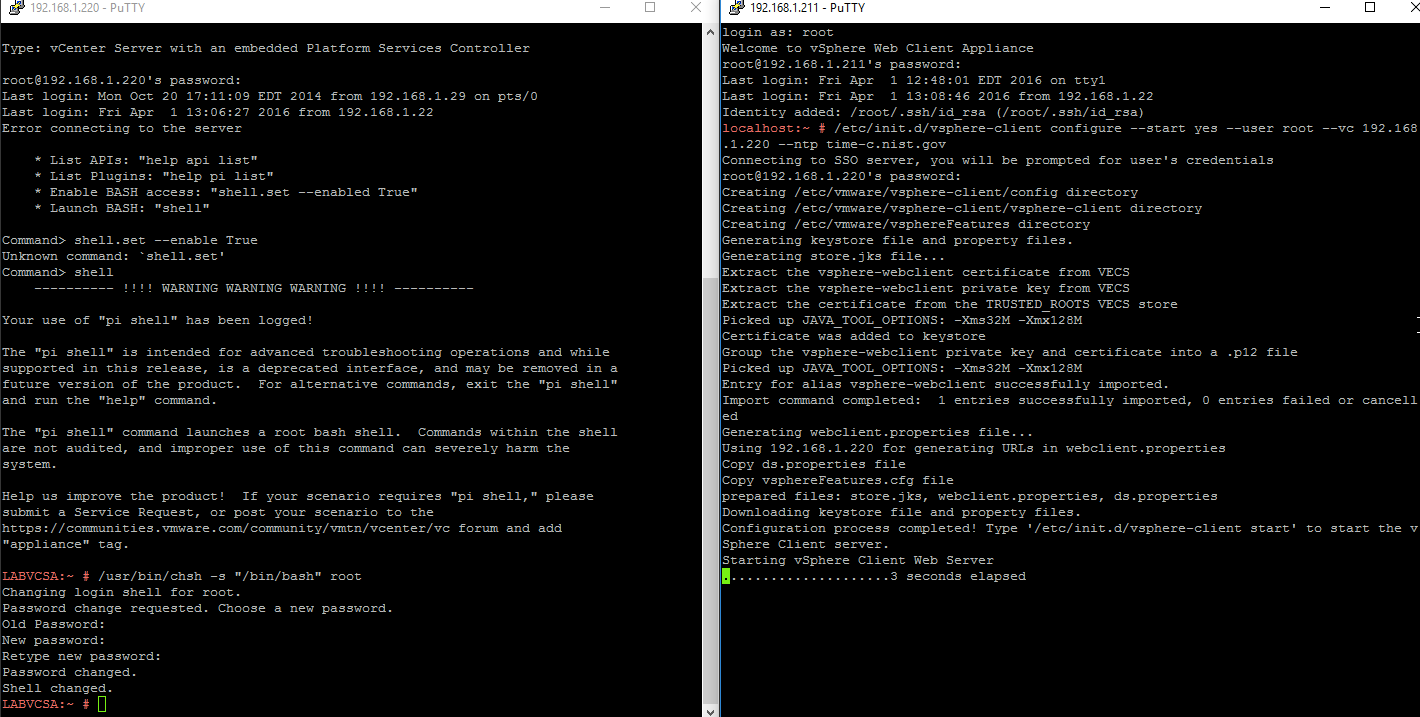
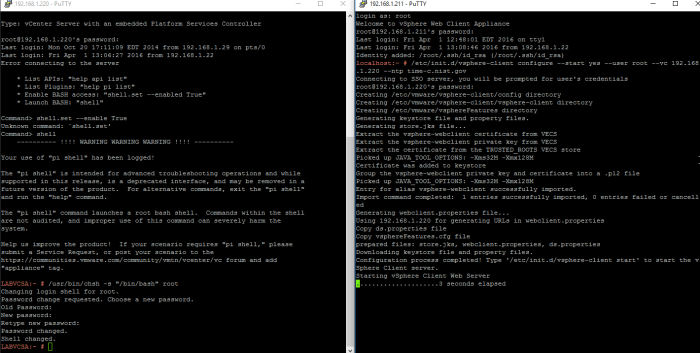
After deploying the OVA, creating an IP Pool, and enabling both SSH and Bash Shell on VCSA, it is time to configure the appliance.
- SSH to the IP address you gave to the appliance using root as the user and demova as the password
- Type shell to access Bash Shell
- run the following command in Bash Shell
- /etc/init.d/vsphere-client configure –start yes –user root –vc <FQDN or IP of vCenter> –ntp <FQDN or IP of NTP server>
- If you need to change the default password for your root account, you can run the following command from bash shell
- /usr/bin/chsh -s “/bin/bash” root
- answer the question by answering YES
- and enter the credentials for your vCenter

The HTML Web Client is pretty awesome, I gotta say, even if not all the features are there yet. It is super clean, and responsive. I can’t wait for it to be embedded with a full feature set.