
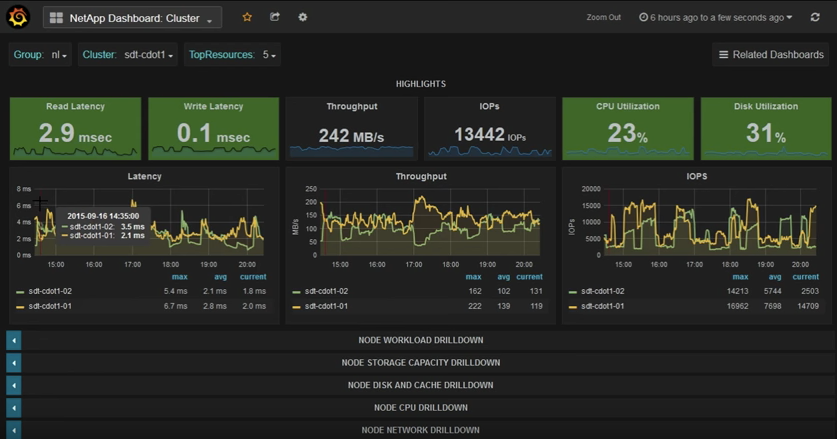
For those that went to either NetApp Insight US or EMEA, the grafana UI used for the Neto’s wicked demo looks very familiar.
NetApp recently released a tool called Harvest, which extracts information from the ONTAP nodes/clusters as well as OnCommand Unified Manager (OCUM) and presents such information in a really cool dashboard. This advaced Performance Monitoring already includes pre-built metrics for both performance and capacity that will allow any NetApp admin to quickly look at many, many key aspects of the environment, and quickly discern whether or not there are any bottlenecks/issues.
I like to think of this tool as OCUM (OnCommand Unified Manager) in steroids, with a hint of OPM (OnCommand Performance Manager) (maybe the other way around) and a great UI. Instructions here. This tool is so cool, we are starting to offer this to our customers.
The complete solution is composed of NetApp’s Harvest tool, Graphite for DB and parsing and Grafana as the Web UI. Harvest is available to download from NetApp’s support page, and both Graphite and Grafana are open source (free).
Chris Madden (NetApp), has created a cool video about this solution, as well as step-by-step deployment instructions here.
